Severe Weather Analysis
A complete analysis can be found in the following R Markdown document.
The basic goal of this analysis is to explore the NOAA Storm Database and answer some basic questions about severe weather events. In this analysis we want to find out, accross the US, which types of events (as indicated in the EVTYPE variable) are most harmful with respect to population health and which types of events have the greatest economic consequences. The Event Type variable was cleaned and the variables regarding property and crop damages were cleaned as well and aggregated in a single variable economiccost. Injuries and Fatalities were aggregated as well in a single variable healthcost. The analysis found that Tornadoes and heavy winds are most harmful to population health and Hurricanes as well as tornados have the greatest economic consequences.
In the following, we can see both, the Event Types with the greatest economic consequences and the Event Types most harmful to population health.
library(plyr)
EconomicCostEventType<-ddply(data,"evtype",summarize,economiccost=sum(economiccost))
HealthCostEventType<-ddply(data,"evtype",summarize,healthcost=sum(healthcost))
EconomicCostEventType<-EconomicCostEventType[order(EconomicCostEventType$economiccost,decreasing = TRUE),]
HealthCostEventType<-HealthCostEventType[order(HealthCostEventType$healthcost,decreasing = TRUE),]
head(EconomicCostEventType)
head(HealthCostEventType)
The event types with greatest economic consequences are: Hurricanes with a cost of 88 billion dollars followed by tornadoes with a total cost of 59 billion dollars.
barplot(EconomicCostEventType[1:10,2]/1e6,
        ylab="millions of US$",
        main="Costliest Severe Weather Events",
        names.arg=EconomicCostEventType$evtype[1:10],
        las=2)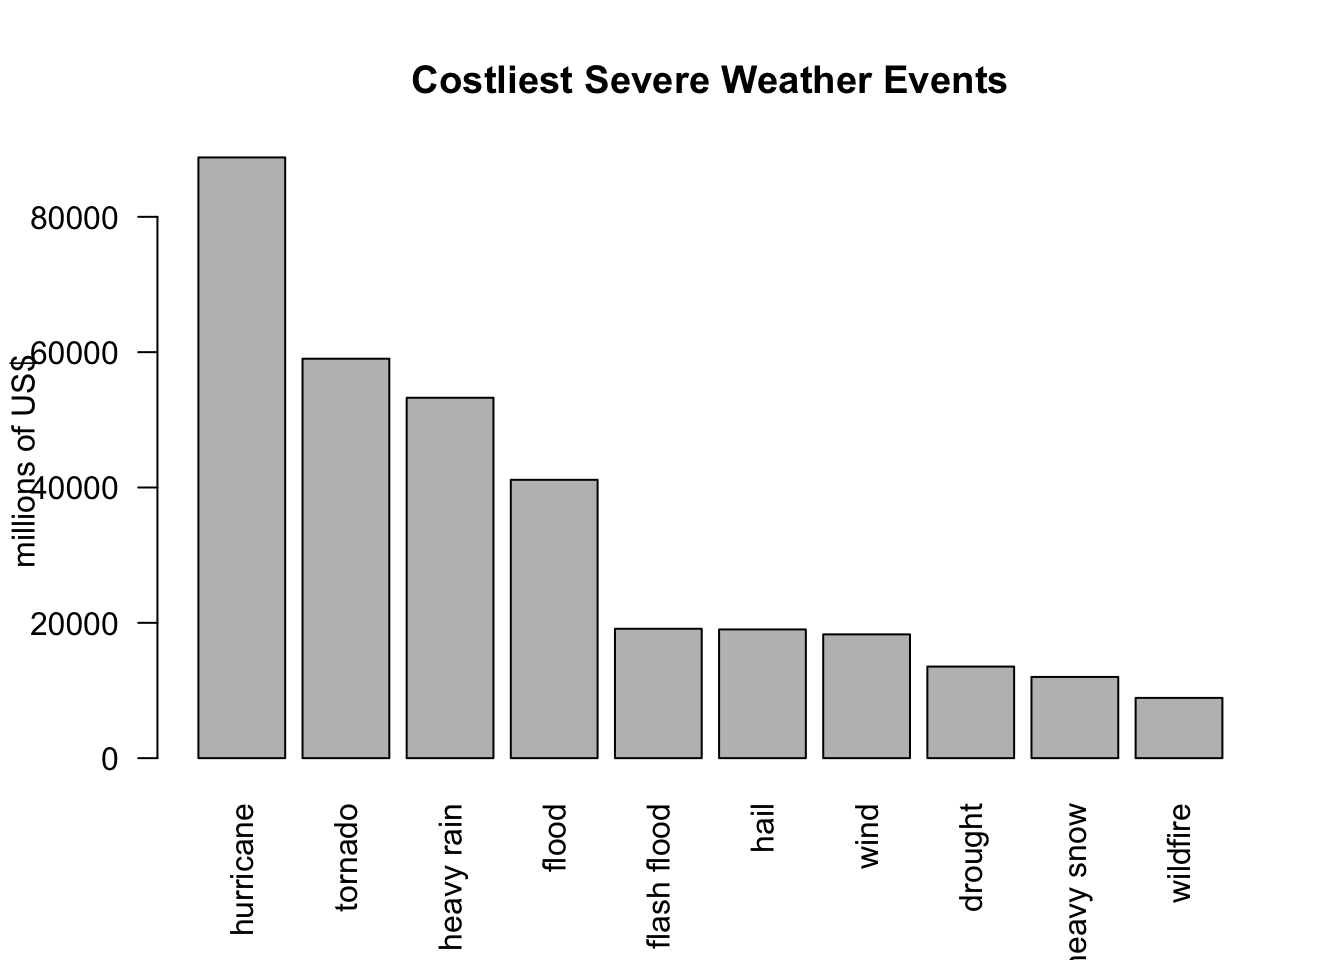
The event types most harmful to population health are: Tornados with 97100 injuries/casualties combined followed by Heavy Wind with 12577 injuries/casualties.
barplot(HealthCostEventType[1:10,2],
        ylab="Number of Injuries and Casualties",
        main="Most Harmful Severe Weather Events",
        names.arg=HealthCostEventType$evtype[1:10],
        las=2)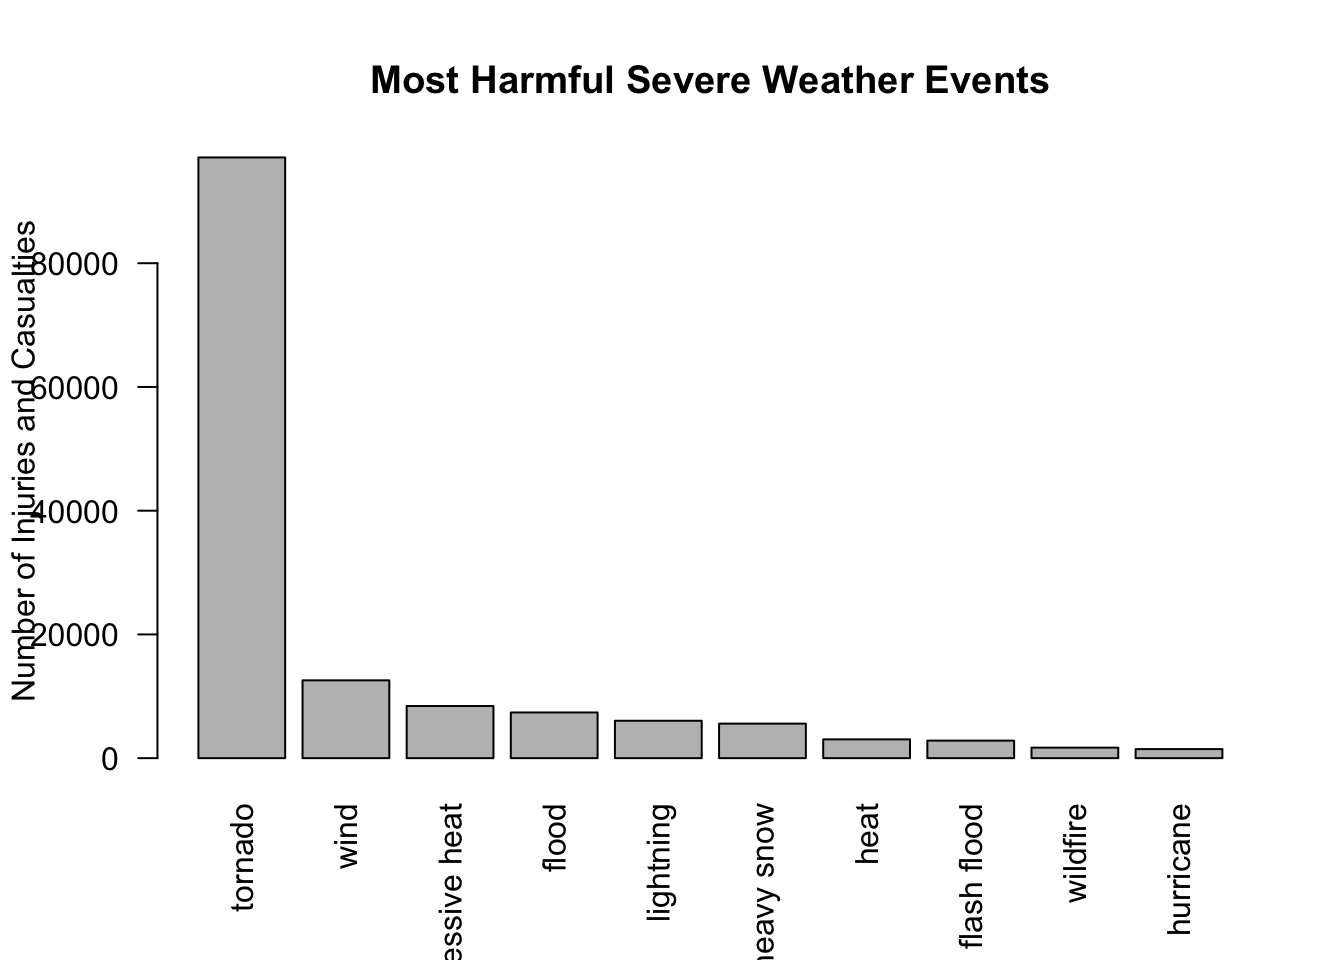
References
[1] National Weather Service Storm Data Documentation
[2] National Climatic Data Center Storm Events FAQ
[3] Storms and Flooding in California in December 2005 and January 2006–a Preliminary Assessment accessed: Oct 25,2014